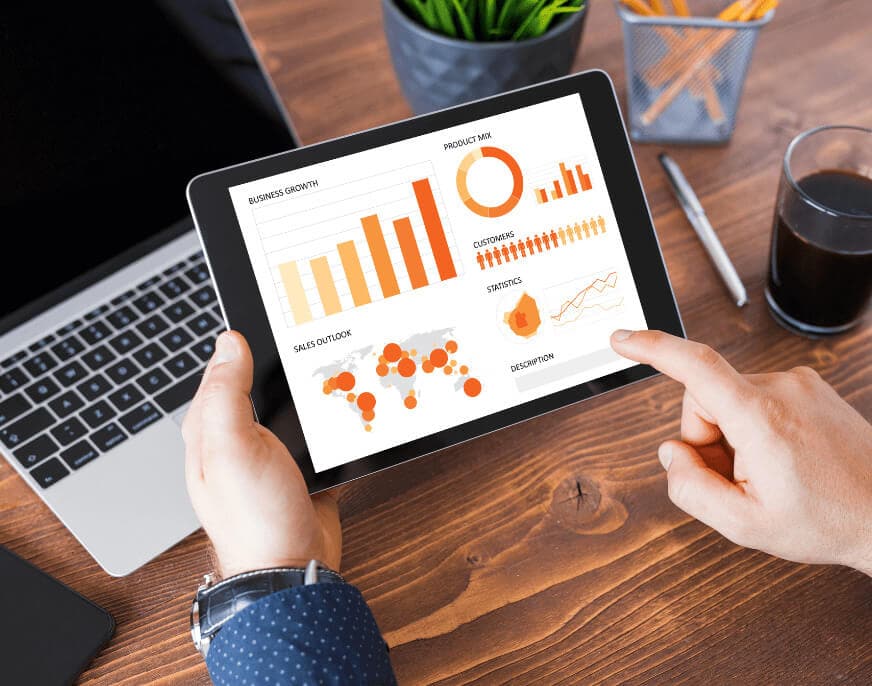
Turn Data Into Actionable Insights
Transform Data into Strategy with Our Data Analytics Consulting Services
We are believe data should work for you, not against you. Through our data and analytics consulting, we make sure complex information easier to understand and act on. We are the experienced analytics as a service providers, we help you discover insights, plan smarter strategies, and confidently shape decisions that support your business goals.

How We Deliver Results
Optimize Every Workflow Using Expert Data Analytics Consulting Services
We help businesses transform complex datasets into actionable insights using data visualisation open source tools, visual analytics, and advanced data visualization solutions. Make informed decisions faster, operations, and uncover opportunities hidden in your data.
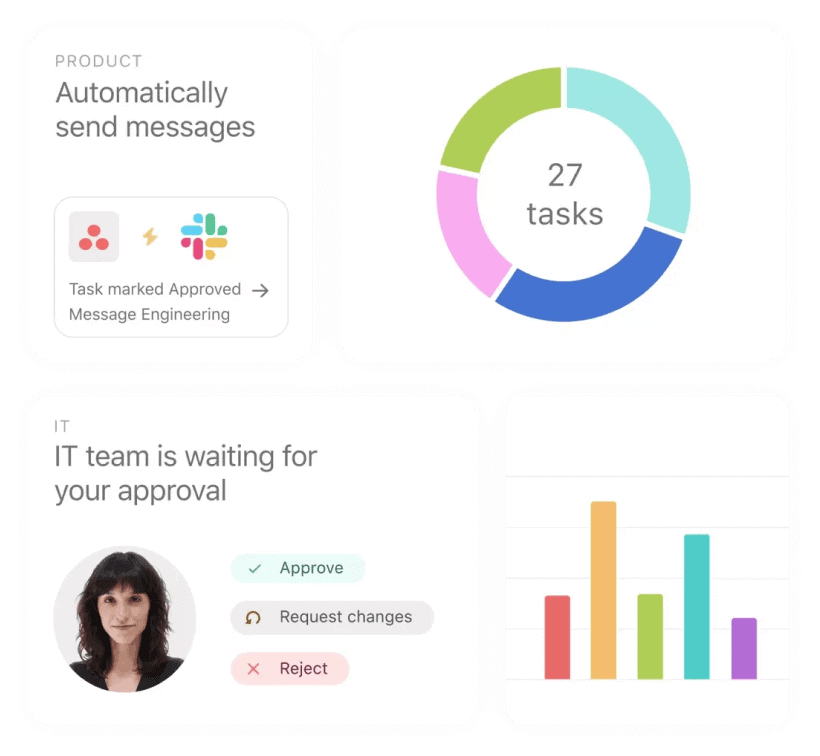
Insights That Inspire Action
We help businesses convert complex information into meaningful decisions. Through our data analytics consulting services and intuitive data visualization solutions, teams can uncover patterns, workflows, and confidently take action that drives measurable growth.
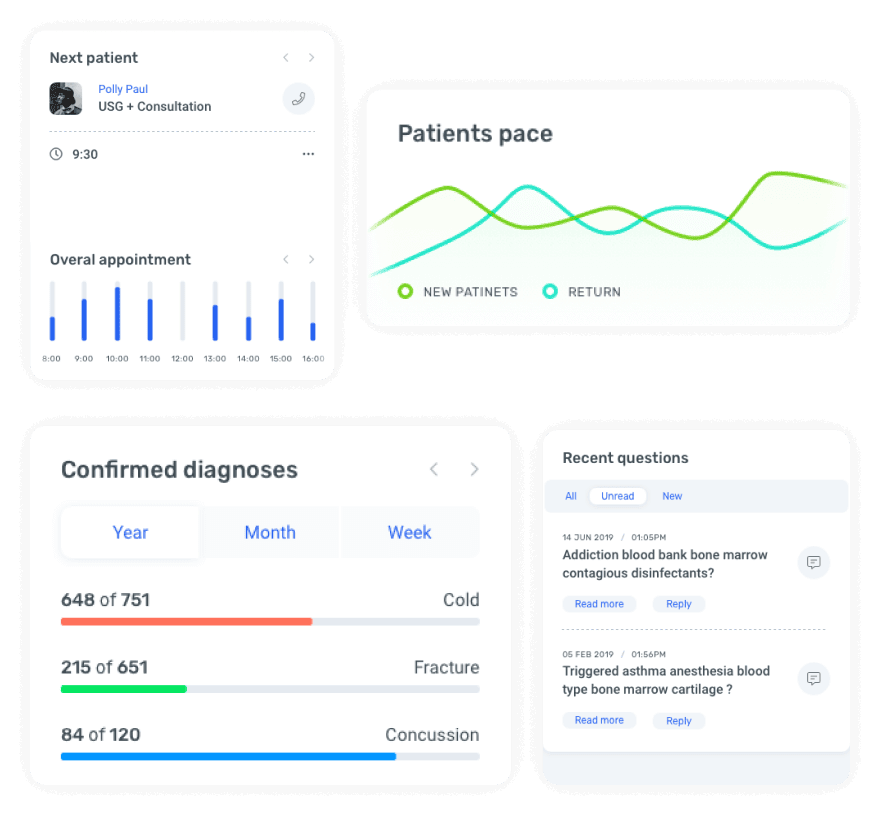
Seeing the Invisible
Unlock hidden opportunities that most businesses overlook. Using top data analytics techniques and SAS data analytics, we reveal trends and correlations, empowering your team to make smarter, faster, and more informed decisions.
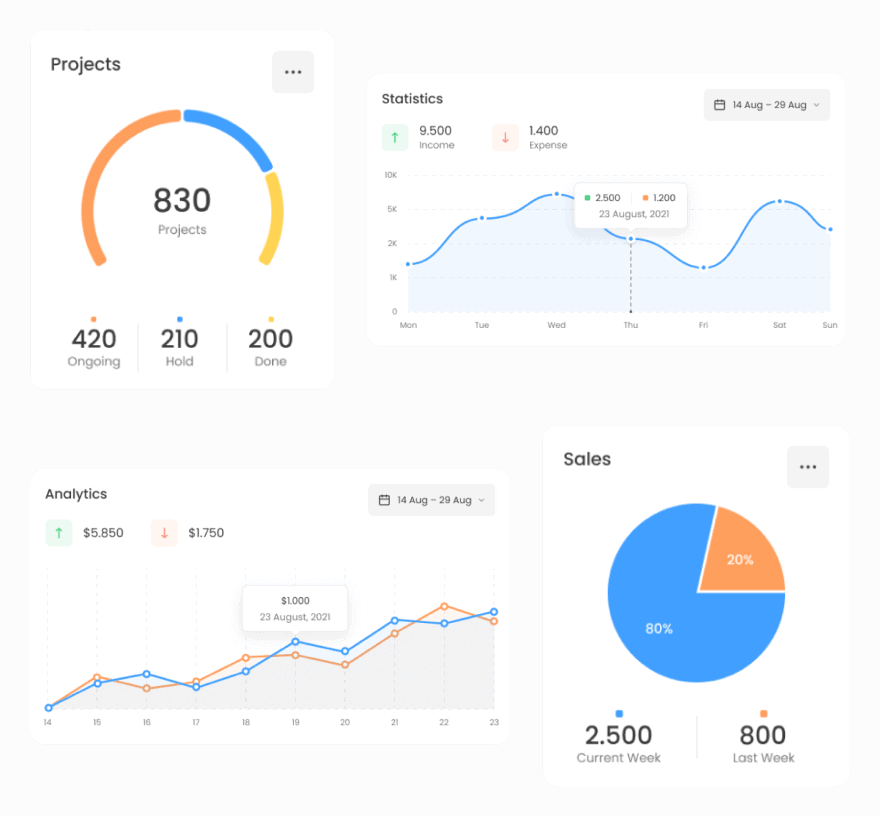
Analytics That Predict Tomorrow
We are the best data visualization tools and advanced top data analysis software, we help businesses anticipate trends, forecast outcomes, and gain a competitive edge in a constantly evolving market.
Key Business Benefits
Data Analytics & Visualization, you will unlock with us.
01
Smarter Decision-Making
Gain instant insights with interactive, real-time dashboards that showcase key KPIs. Our visual analytics empower teams to understand performance at a glance, make informed decisions, and drive meaningful business outcomes faster and smarter.
02
Predictive Business Insights
Anticipate trends, market changes, and operational challenges before they happen. Our predictive insights help your team act proactively, optimize strategies, and stay ahead of the competition with confidence and clarity.
03
Simplified Reporting
Transform cumbersome, manual reports into intuitive, interactive visual dashboards. Our data visualization solutions simplify complex information, making insights instantly accessible, actionable, and easier for teams to drive smarter, faster business decisions.
04
Unified Data Ecosystem
Eliminate data silos and unify information into a single, centralized hub. Our approach ensures accurate, transparent insights, enabling teams to collaborate effectively, make informed decisions, and gain a clear, comprehensive view of business performance.
05
Faster Performance Monitoring
Monitor operational and financial performance instantly with real-time dashboards. Our solutions accelerate speed-to-insight, allowing teams to spot trends, address issues proactively, and make informed decisions that drive efficiency and business growth.
DROP US A LINE
Connect with BytezTech
Ready to take the first step towards unlocking opportunities, realizing goals, and embracing innovation? We're here and eager to connect.

Call us now:
+91 6351100121

Write to us on: